In the following tutorial you will learn how to create a simple line chart design in Adobe Illustrator.
For starters you will learn how to setup a simple grid and how to create a smooth background. Moving on you will create the main shape and you will learn how to add subtle shading and highlights using the Appearance panel and a series of effects. Using the Transform effect and basic stroke attributes you will create that subtle grid. You will learn how to create and edit a simple piece of text and how to easily multiply or rotate shapes. Finally, you will learn how to ease your work using graphic styles.
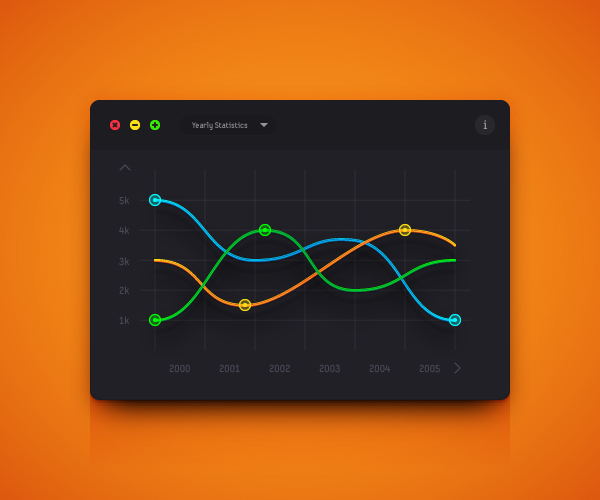
Final Image
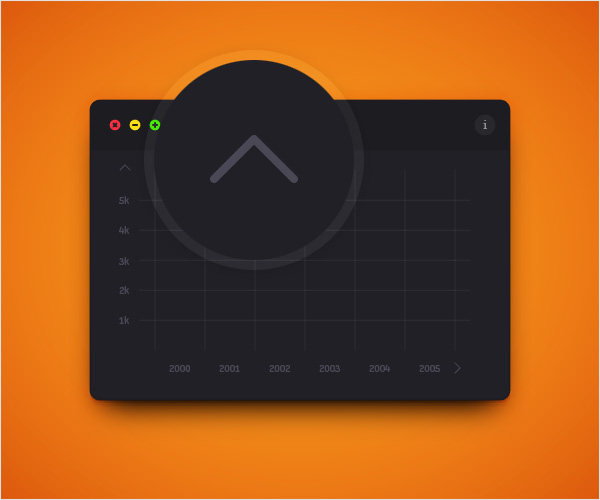
As always, this is the final image that we’ll be creating:
Tutorial Details
- Program: Adobe Illustrator CC
- Estimated Completion Time: 45 minutes
- Difficulty: Beginner-Intermediate
Resources
Step 1
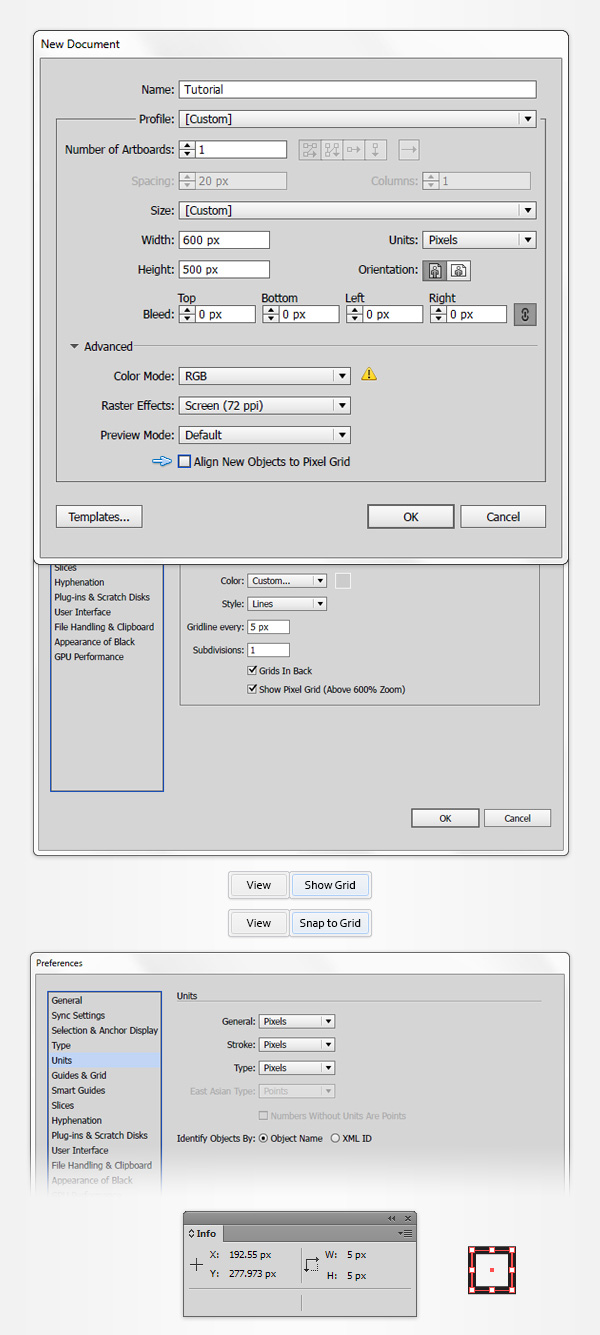
Hit Control + N to create a new document. Select Pixels from the Units drop-down menu, enter 600 in the width box and 500 in the height box and then click the Advanced button. Select RGB, Screen (72ppi) and make sure that the Align New Objects to Pixel Grid box is unchecked before you click OK.
Enable the Grid (View > Show Grid) and the Snap to Grid (View > Snap to Grid). For starters you will need a grid every 5 px, so simply go to Edit > Preferences > Guides > Grid, enter 5 in the Gridline every box and 1 in the Subdivisions box. Try not to get discouraged by all that grid, it will ease your work and keep in mind that you can easily enable or disable it using the Control + " keyboard shortcut.
You should also open the Info panel (Window > Info) for a live preview with the size and position of your shapes. Do not forget to set the unit of measurement to pixels from Edit > Preferences > Units > General. All these options will significantly increase your work speed.
Step 2
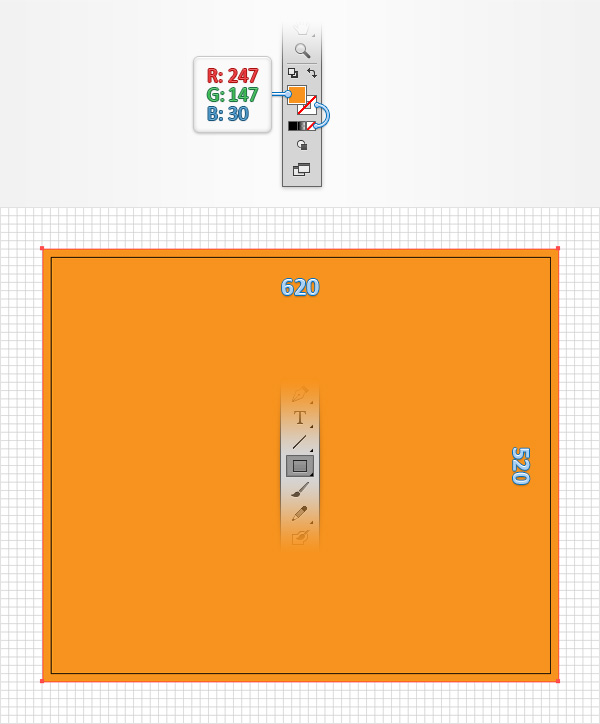
Pick the Rectangle Tool (M) and focus on your Toolbar. Remove the color from the stroke then select the fill and set its color to R=247 G=147 B=30. Move to your artboard and create a 620 x 520 px rectangle – the grid and the Snap to Grid feature should ease your work. Make sure that your shape covers the entire artboard.
Step 3
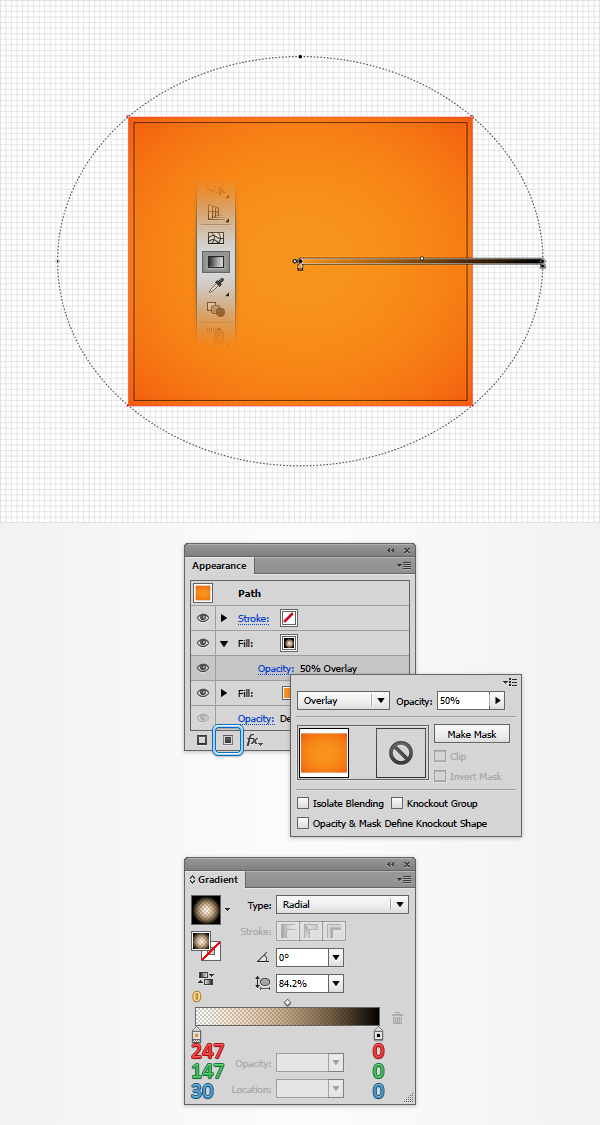
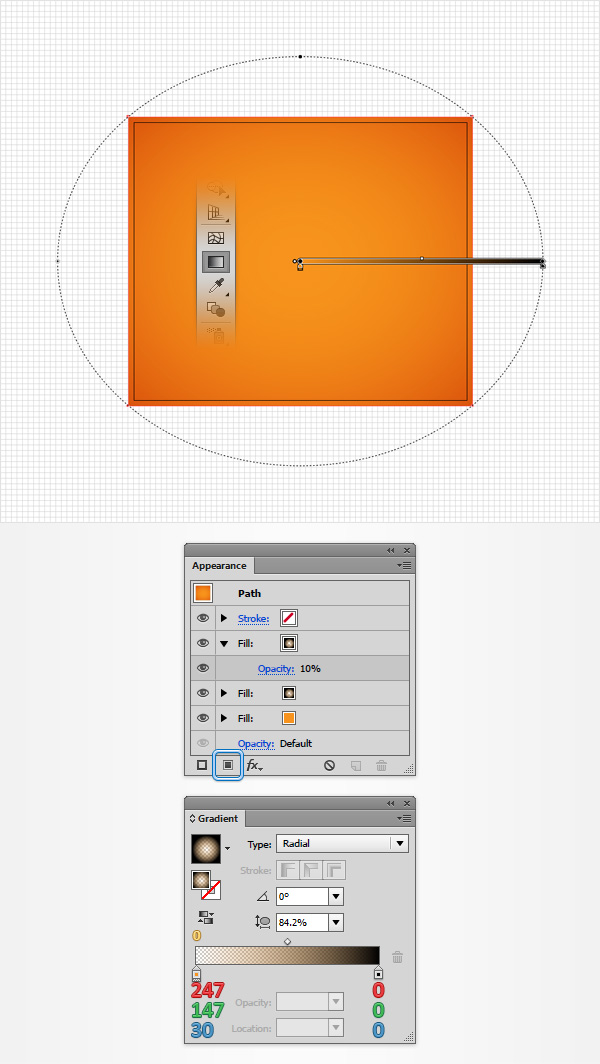
Make sure that your orange rectangle is still selected, focus on the Appearance panel (Window > Appearance) and add a second fill using the Add New Fill button.
Select the fill and replace the existing color with the radial gradient shown in the following image. Keep in mind that the yellow zero from the Gradient image (Window > Gradient) stands for Opacity percentage and use the Gradient Tool (G) to easily adjust the size of your gradient.
Return to the Appearance panel, keep focusing on the newly added fill and click that "Opacity" piece of text to open the Transparency fly-out panel.
Change the Blending Mode to Overlay and lower the Opacity to 50%.
Step 4
Make sure that your orange rectangle is still selected, keep focusing on the Appearance panel and add a third fill using that same Add New Fill button.
Select the newly added fill, lower its Opacity to 10% and then add the radial gradient shown below. Don’t forget that the yellow zero from the Gradient image stands for Opacity percentage.
Step 5
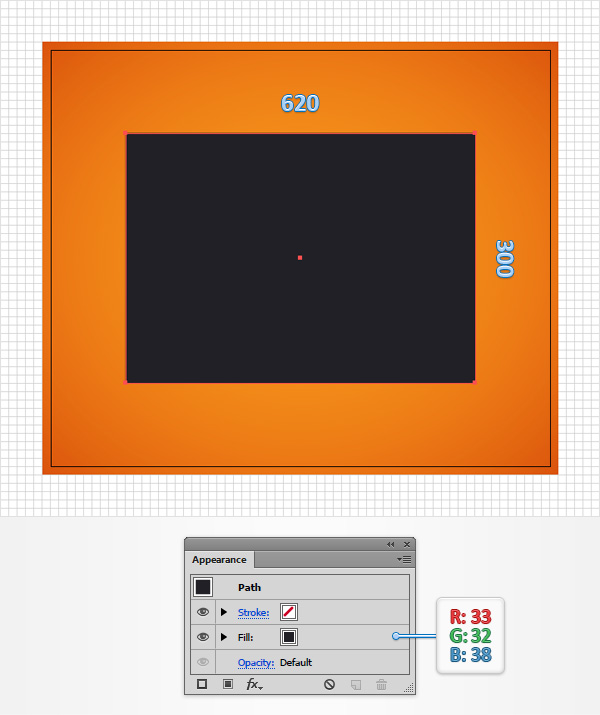
Using the Rectangle Tool (M), create a 620 x 300 px shape, fill it with R=33 G=32 B=38 and then place it as shown in the following image.
Step 6
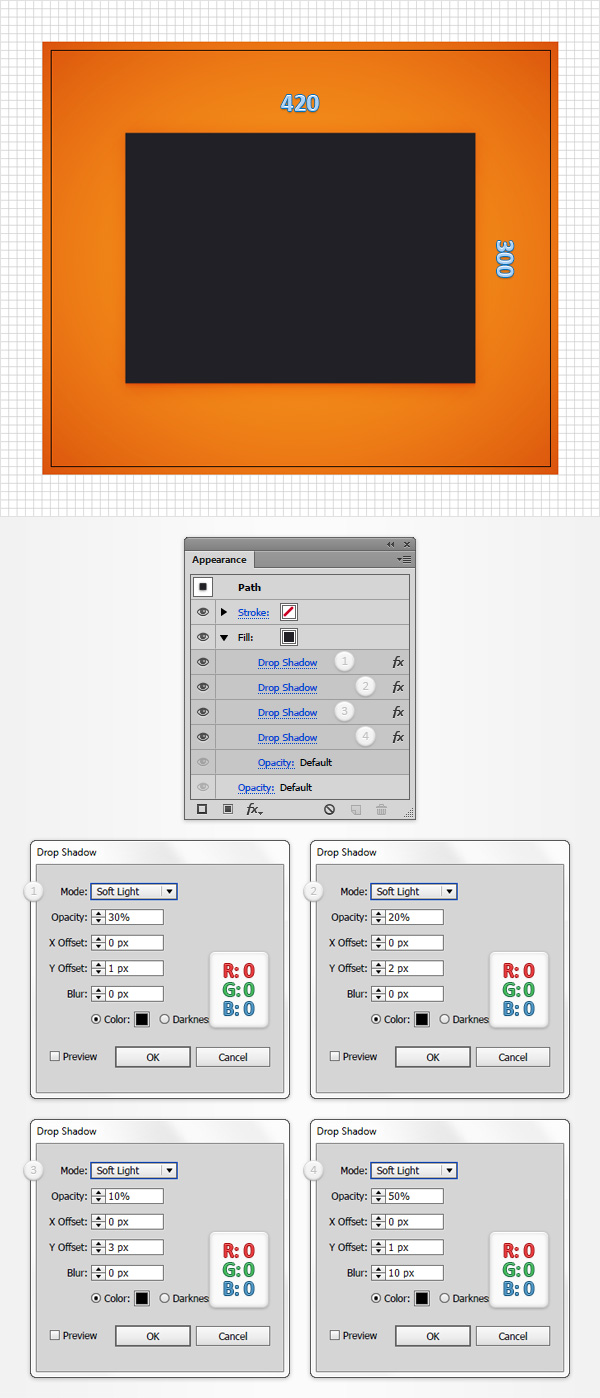
Make sure that your dark rectangle is still selected and focus on the Appearance panel. Select the existing fill and go to Effect > Stylize > Drop Shadow. Enter the attributes shown in the top, left window (in the following image)
Click the OK button and then add the other three Drop Shadow effects shown below.
Step 7
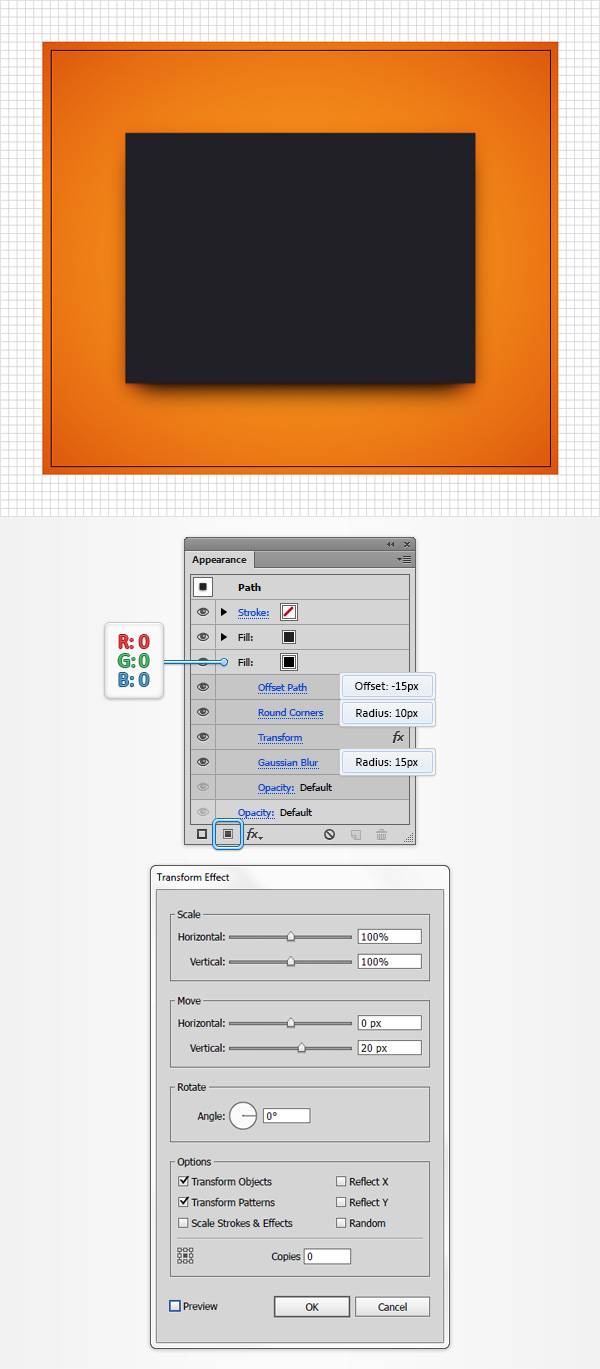
Make sure that your dark rectangle is still selected, keep focusing on the Appearance panel and add a second fill.
Drag it below the existing fill, set the color to black and then go to Effect > Path > Offset Path. Enter a -15 px Offset, click the OK button.
Go to Effect > Stylize > Rounded Corners. Enter a 10 px Radius, click the OK button.
Go to Effect > Distort & Transform > Transform. Enter the attributes shown below, click OK.
Go to Effect > Blur > Gaussian Blur. Enter a 15 px Radius and then click the the OK button.
Step 8
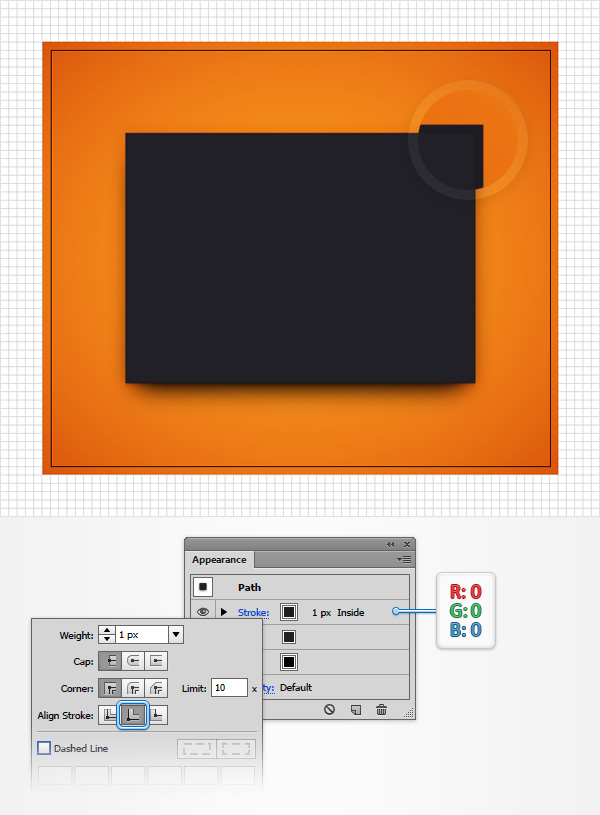
Make sure that your dark rectangle is still selected and keep focusing on the Appearance panel. Select the existing stroke, make it black and then click that "Stroke" piece of text to open the Stroke fly-out panel.
Be sure that the Weight is set to 1 px and then check the Align Stroke to Inside button.
Step 9
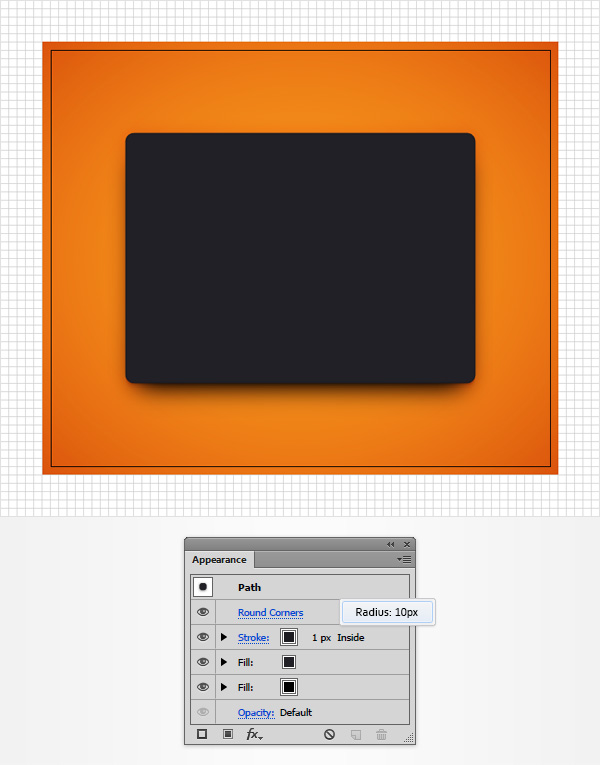
Reselect your dark rectangle, be sure that the entire path is selected (click that "Path" piece of text from the top of the panel) and then go to Effect > Stylize > Rounded Corners. Enter a 10 px Radius and then click the OK button.
Step 10
Using the Rectangle Tool (M), create a 420 x 50 px shape, fill it with R=29 G=28 B=33 and place it as shown in the first image.
Focus on the top side of this new rectangle and switch to the Direct Selection Tool (A). Select both anchor points, move to the options bar and enter 10 px in the Corners box.
This feature is only available for CC users. The best solution to replace this effect would be the Round Any Corner script that you can find in this tutorial (check Resources on top of this page). Save it to your hard drive, return to Illustrator and grab the Direct Selection Tool (A). Select the same two anchor points and go to File > Scripts > Other Script. Open the Round Any Corner Script, enter a 10 px radius and click OK.

Step 11
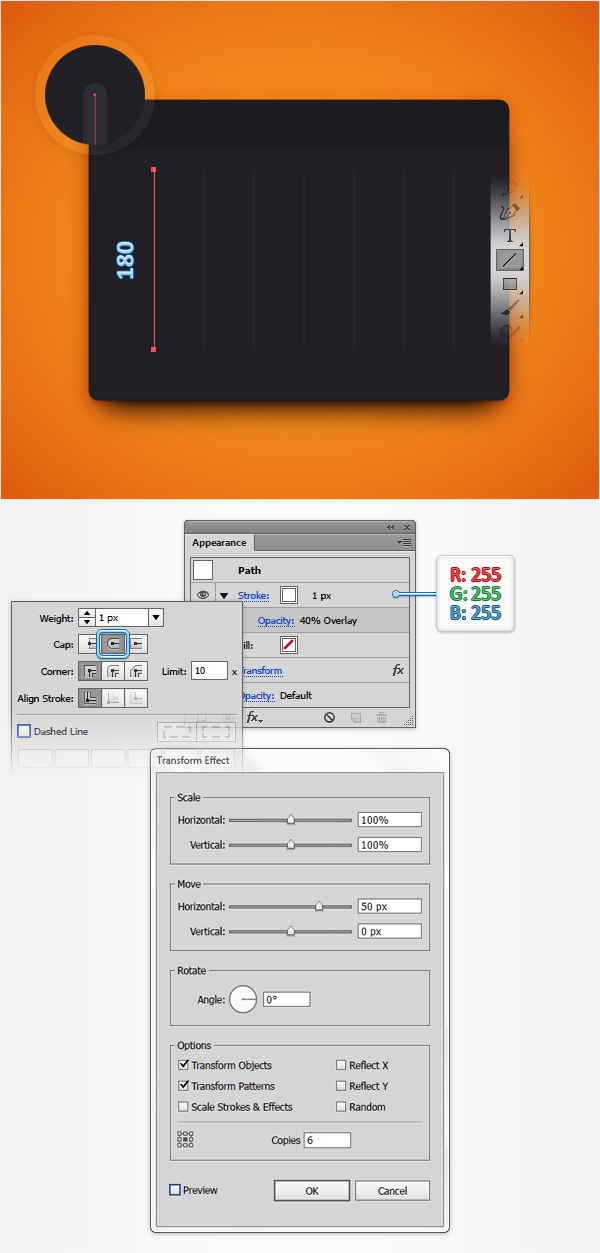
Using the Line Segment Tool (\), create a 180 px, vertical path and place it as shown in the following image.
Add a 1px, white stroke for this new path, lower its Opacity to 40% and change the Blending Mode to Overlay.
Open the Stroke fly-out panel, make sure that the Weight is set to 1 px and then click the Round Cap button.
With this vertical path still selected go to Effect > Distort & Transform > Transform. Enter the attributes shown in the following image and then click the OK button.
Step 12
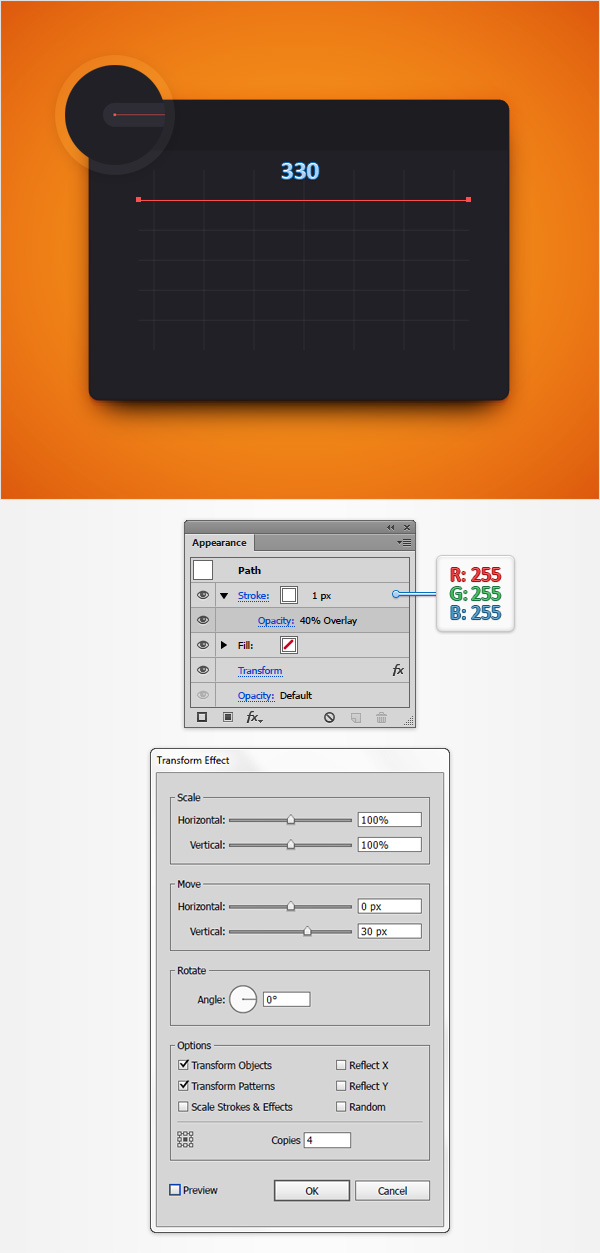
Using that same Line Segment Tool (\), create a 330 px, horizontal path and place it as shown in the following image.
Add a 1px, white stroke for this new path, lower its Opacity to 40% and change the Blending Mode to Overlay.
Again, open the Stroke fly-out panel, make sure that the Weight is set to 1 px and then click the Round Cap button.
With this horizontal path still selected go to Effect > Distort & Transform > Transform. Enter the attributes shown in the following image and then click the OK button.
Step 13
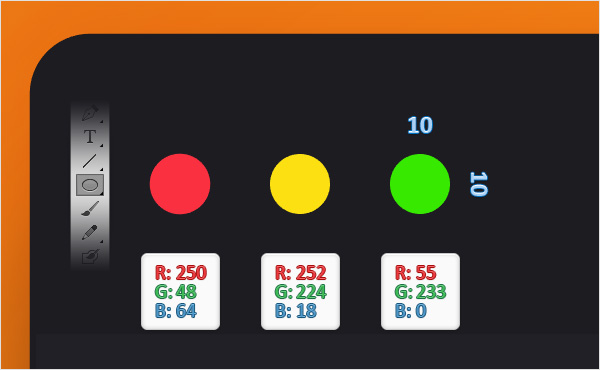
Using the Ellipse Tool (L), create three, 10 px circles. Make sure that you’re placing these new shapes as shown in the following image and fill them with the three colors indicated below.
Step 14
For this step you will need a grid every 1 px, so go to Edit > Preferences > Guides & Grid and enter 1 in the Gridline every box.
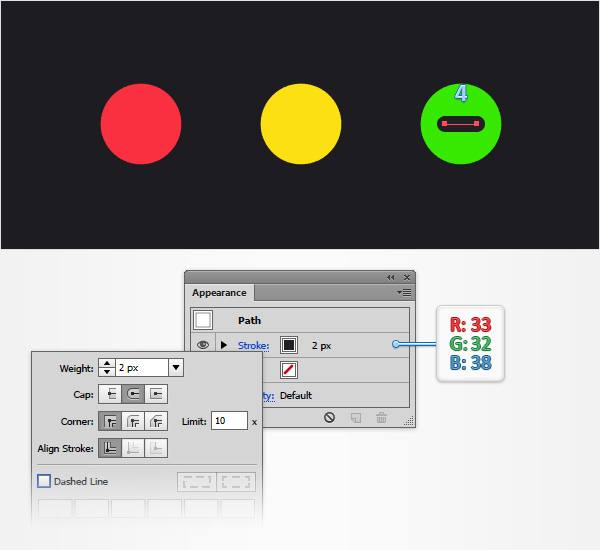
Using the Line Segment Tool (\), create a 4 px, horizontal path and place it as shown in the following image.
Add a 2 px stroke for this new path, set its color to R=33 G=32 B=38 and then open the Stroke fly-out panel and check the Round Cap button.
Step 15
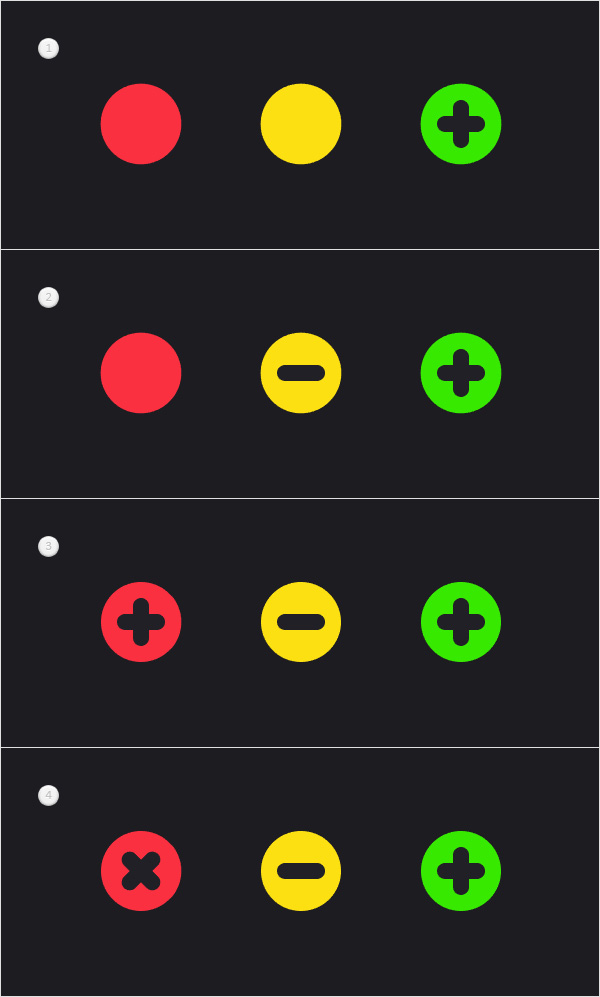
Make sure that the horizontal path made in the previous step is still selected and make a copy in front (Control + C > Control + F).
Select this copy and rotate it 90 degrees as shown in the first image.
Make a new copy of your 4 px, horizontal path and place it as shown in the second image.
Duplicate the two paths that make up your plus symbol, place the copies as shown in the third image and then rotate them 45 degrees.
Step 16
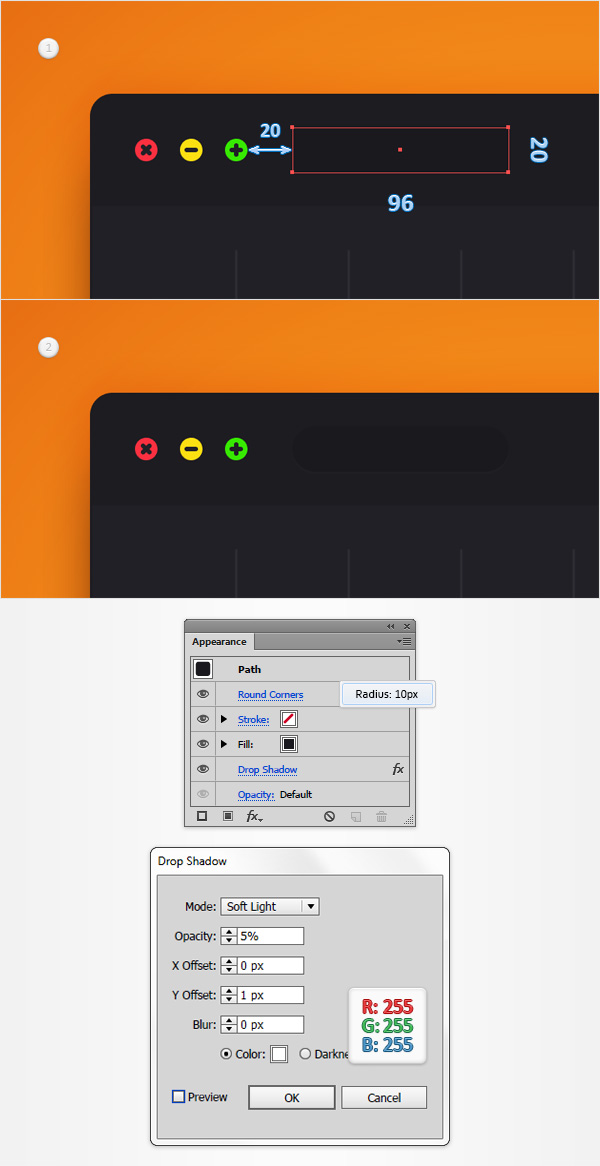
Using the Rectangle Tool (M), create a 96 x 20 px shape and fill it with R=26 G=25 B=30.
Place this new shape as shown in the first image and then go to Effect > Stylize > Rounded Corners. Enter a 10 px Radius and click the OK button.
Go to Effect > Stylize > Drop Shadow. Enter the attributes shown below and then click the OK button.
Step 17
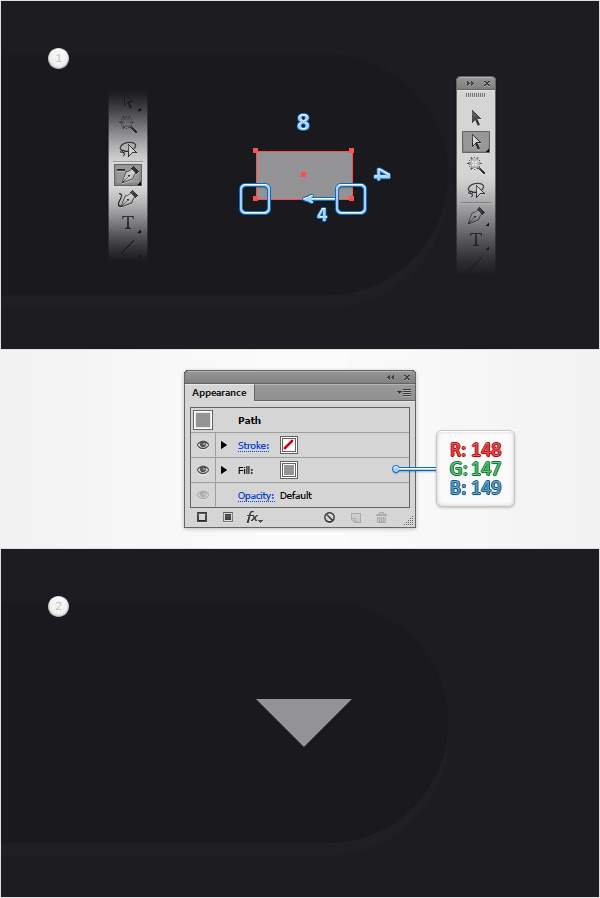
Using the Rectangle Tool (M), create an 8 x 4 px shape, fill it with R=148 G=147 B=149 and place it as shown in the first image.
Focus on the bottom side of this new rectangle and pick the Delete Anchor Point Tool (-). Simply click the left anchor point to remove it and then switch to the Direct Selection Tool (A).
Select the remaining, bottom anchor point and drag it 4 px to the left. In the end your gray rectangle should turn into a triangle as shown in the second image.
Step 18
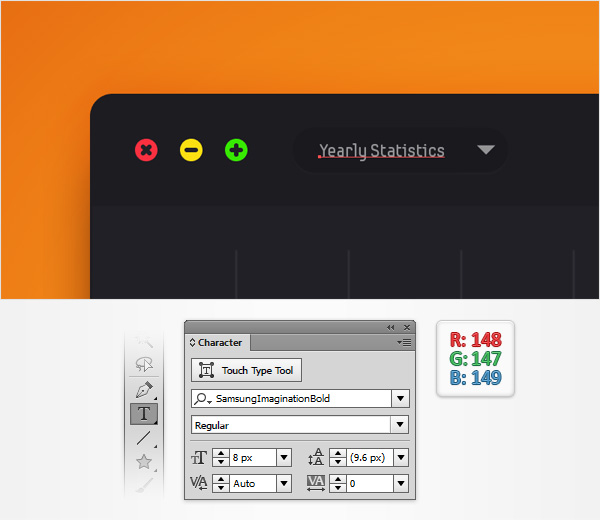
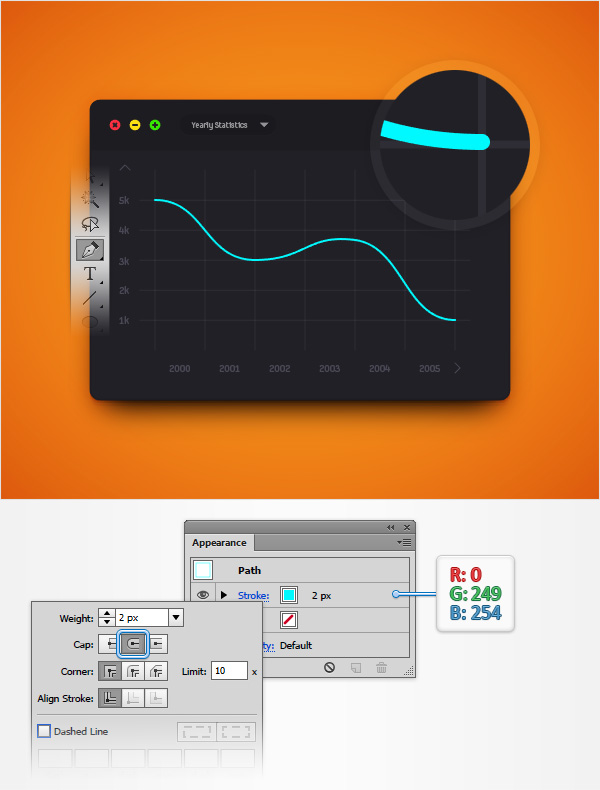
Open the Character panel (Window > Type > Character) and pick the Type Tool (T). Click on your artboard and add the "Yearly Statistics" piece of text.
Set its color to R=148 G=147 B=149 and use the SamsungImaginationBold font with the size set to 8 px.
Step 19
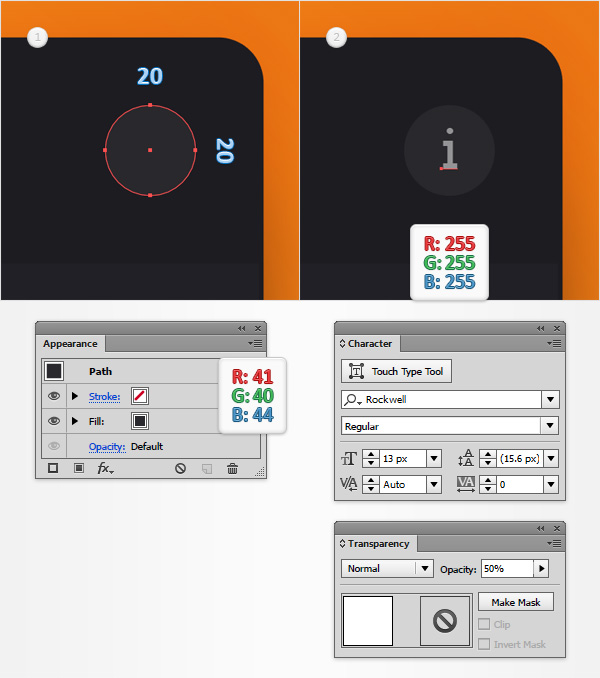
Using the Ellipse Tool (L), create a 20 px circle, fill it with R=41 G=40 B=44 and place it as shown in the first image.
Switch to the Type Tool (T) and add a tiny "i" as shown in the second image. Make it white and use the Rockwell font with the size set to 13 px.
Once you’re done, lower the Opacity of this new piece of text to 50%.
Step 20
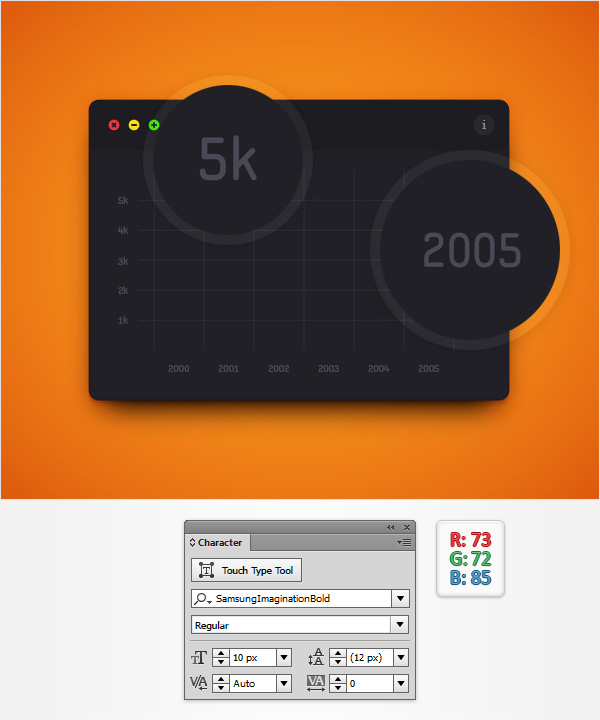
Using the Type Tool (T), add the pieces of text shown in the following image. Use that same SamsungImaginationBold font with the size set to 10 px and make sure that the color is set to R=73 G=72 B=85.
Step 21
Using the Line Segment Tool (\), create a 10 px, vertical path and place it as shown in the first image.
Add a 1 px stroke for this new path and set its color to R=73 G=72 B=85.
Open the Stroke fly-out panel for this new path and check the Round Cap and Round Join buttons.
With this path still selected go to Object > Path > Add Anchor Points. Switch to the Direct Selection Tool (A), select the newly added anchor point and drag it 5 px to the right.
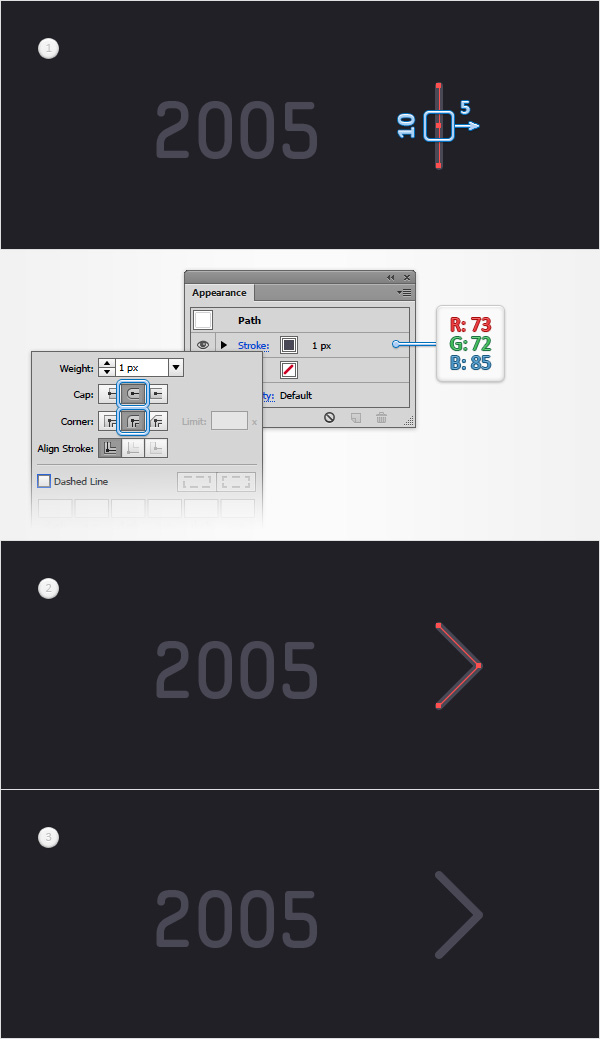
Step 22
Duplicate the path made in the previous step, rotate the copy 45 degrees and then place it as shown in the following image.
Step 23
Using the Pen Tool (P), create a wavy path roughly as shown in the following image. Add a 2 px stroke for this new path, set its color to R=0 G=249 B=254.
Open the Stroke fly-out panel. Increase the Weight to 2 px and don’t forget to check the Round Cap button.
Step 24
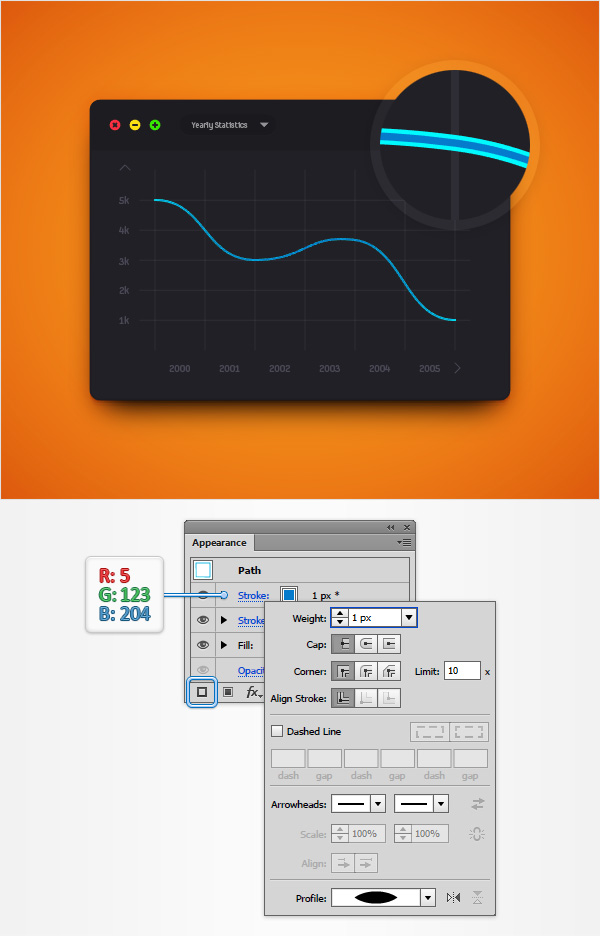
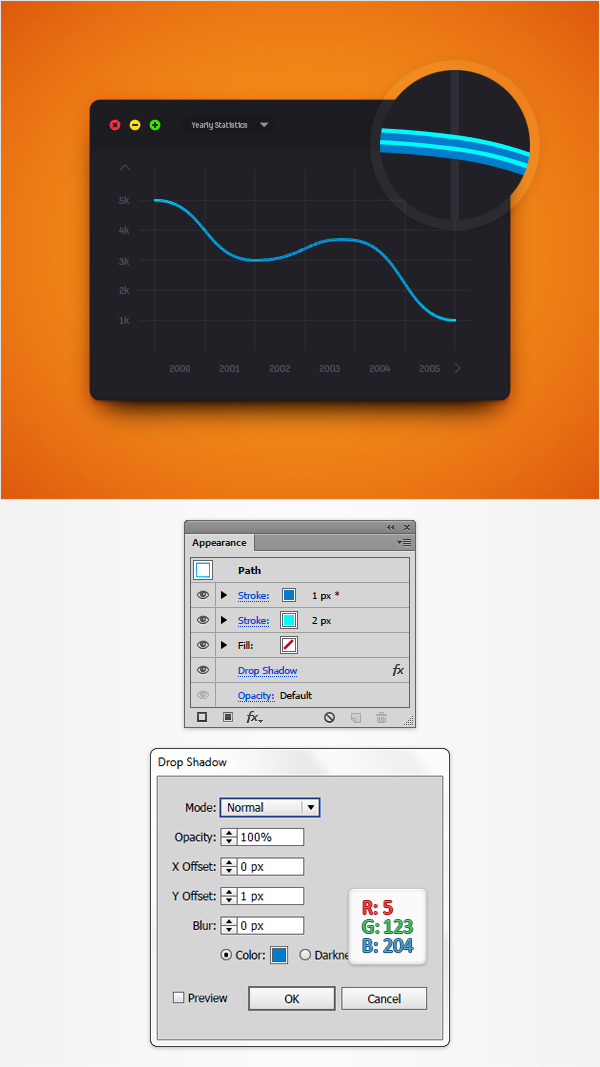
Make sure that your wavy path is still selected, focus on the Appearance panel and add a second stroke using the Add New Stroke button.
Select the new stroke, set its color to R=5 G=123 B=204 and then open its Stroke fly-out panel. Be sure that the Weight is set to 1 px and then go to the Profile drop-down menu and select Width Profile 1.
Step 25
Reselect your wavy path, make sure that the entire path is selected and go to Effect > Stylize > Drop Shadow. Enter the attributes shown below and then click the OK button.
Step 26
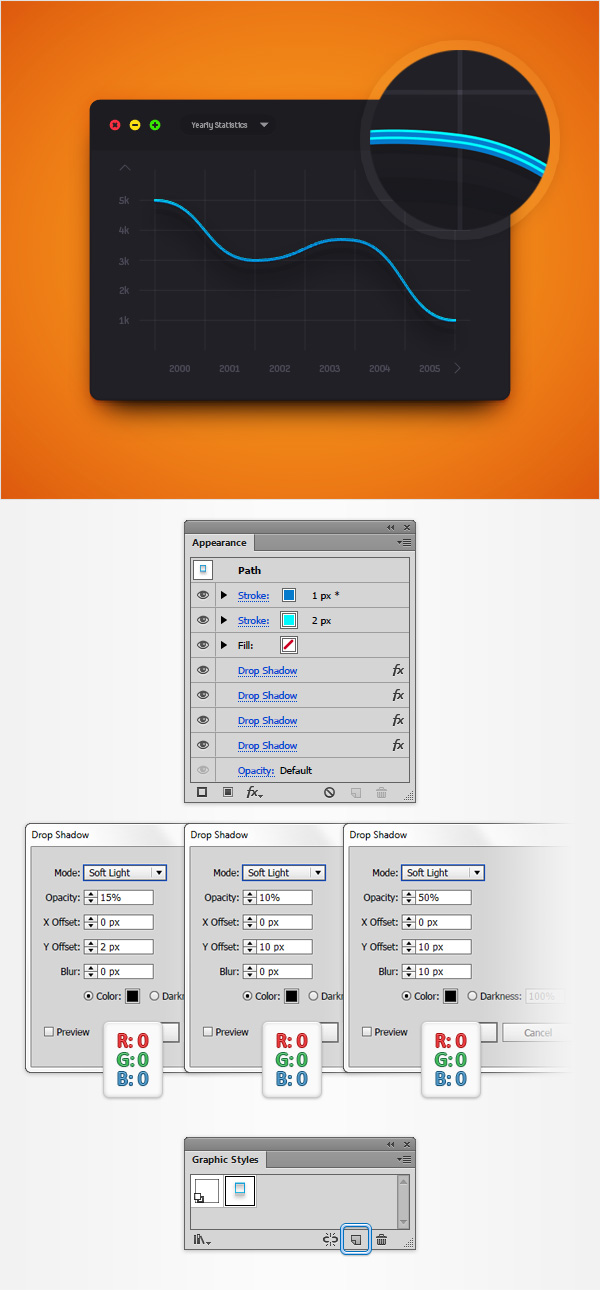
Reselect your wavy path and add the other three Drop Shadow effects shown below.
With this path still selected, open the Graphic Styles panel (Window > Graphic Styles) and simply click the New Graphic Style button.
Step 27
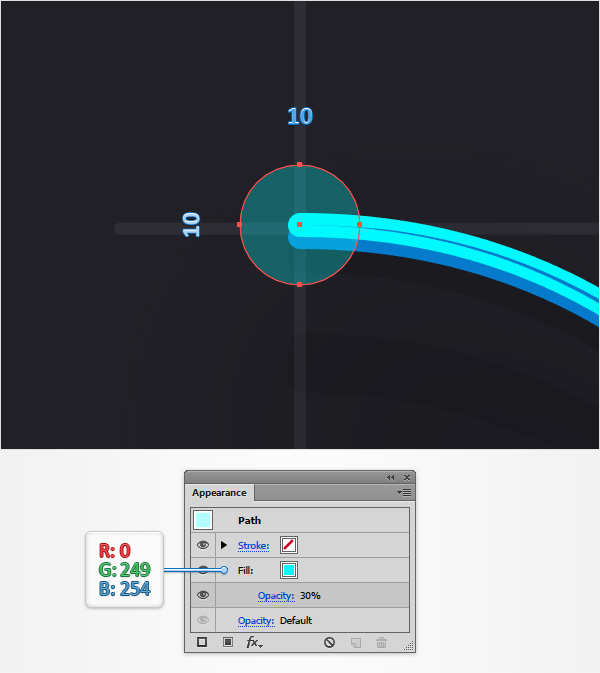
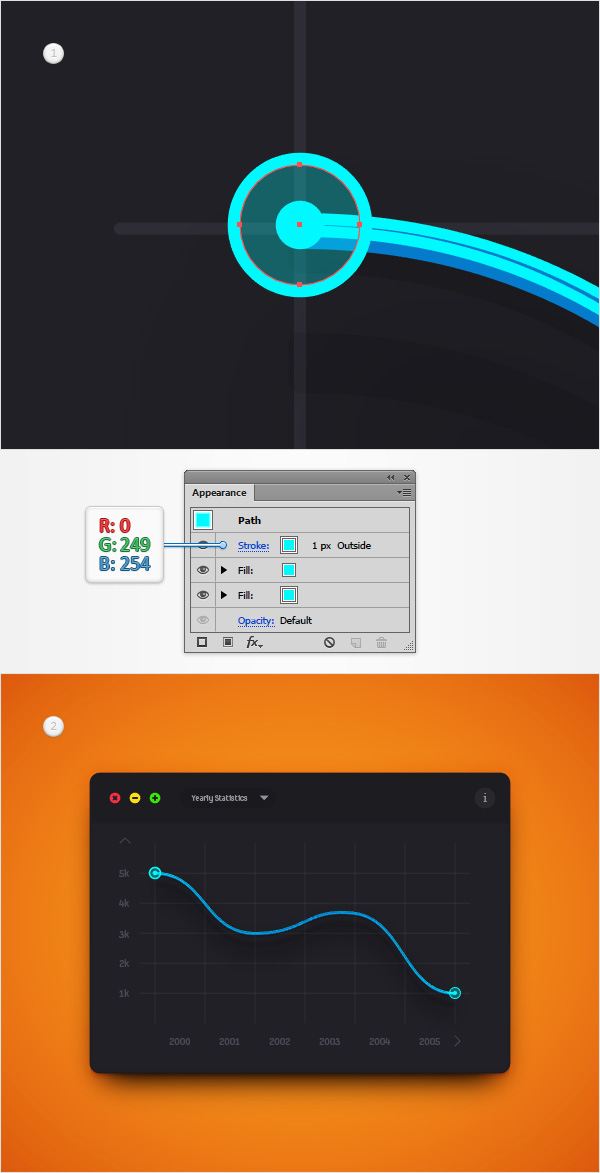
Using the Ellipse Tool (L), create a 10 px circle, fill it with R=0 G=249 B=254 and place it as shown in the first image.
Focus on the Appearance panel, select the existing fill and lower its Opacity to 30%.
Step 28
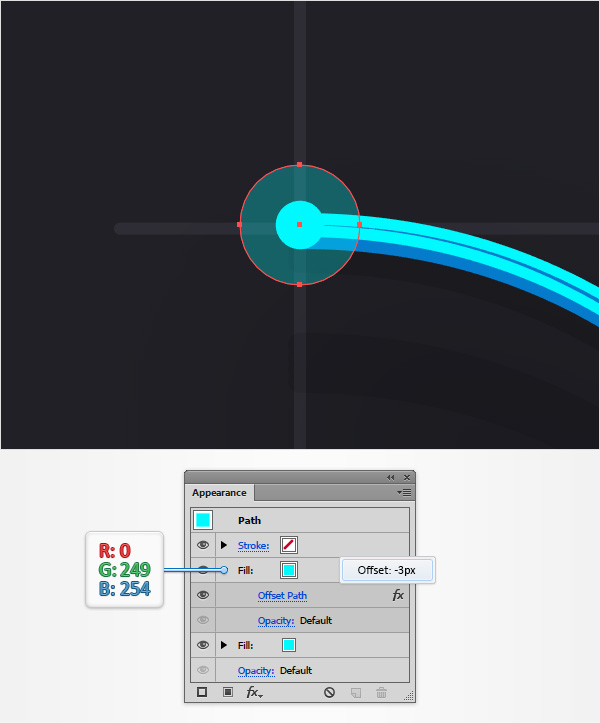
Make sure that your 10 px circle is still selected, focus on the Appearance panel and add a second fill. Select it, set the color to R=0 G=249 B=254 and then go to Effect > Path > Offset Path. Enter a -3 px Offset and click OK.
Step 29
Make sure that your 10 px circle is still selected and keep focusing on the Appearance panel. Select the existing stroke, set its color to R=0 G=249 B=254, be sure that the Weight is set to 1 px and check the Align Stroke to Outside button.
Make a copy of your 10 px circle and place it as shown in the second image.
Step 30
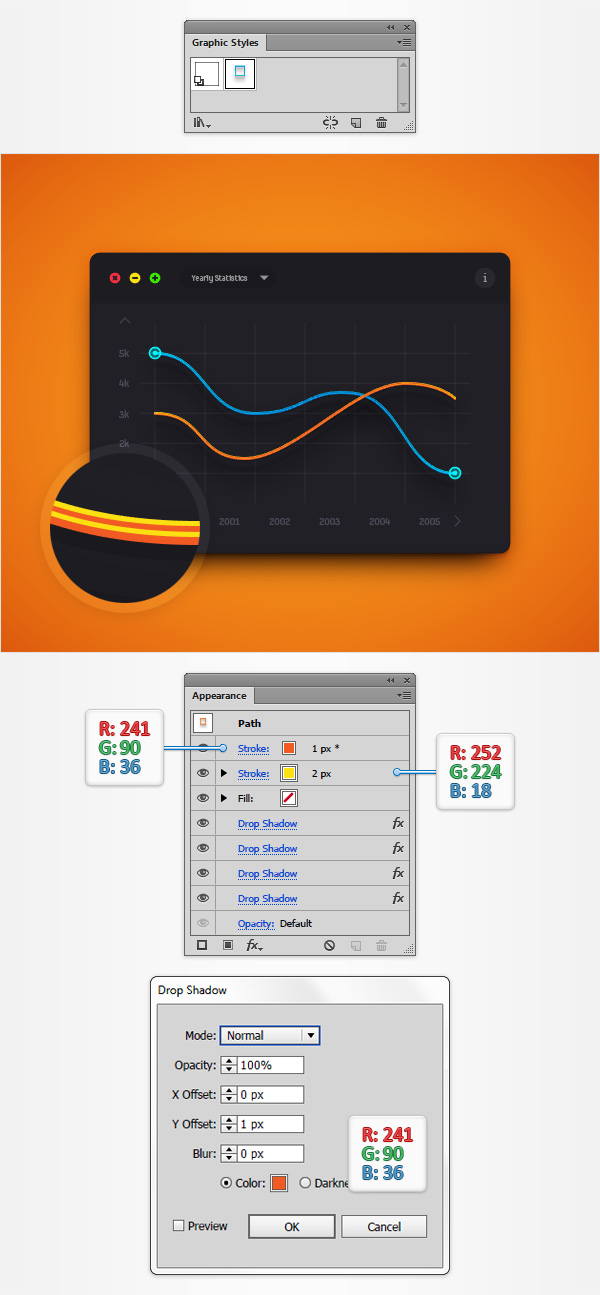
Using the Pen Tool (P), create a second wavy path roughly as shown in the following image.
Add your saved, graphic style for this new path and then focus on the Appearance panel.
Select the stroke and replace the existing color with R=241 G=90 B=36.
Select the fill and replace the existing color with R=252 G=224 B=18.
Open the top Drop Shadow effect and replace the color used for that effect with R=241 G=90 B=36.
Step 31
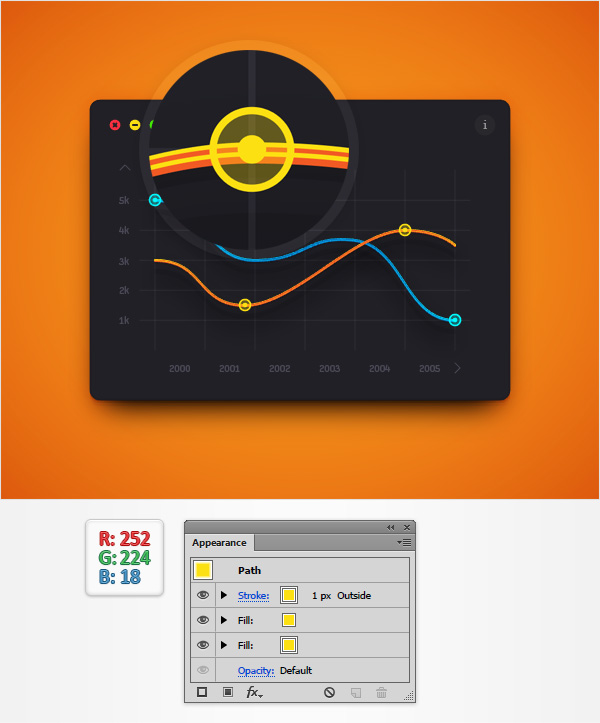
Make two copies of your 10 px circle (Control + C > Control + V). Place them roughly as shown in the following image and replace the blue used for fills and stroke with R=252 G=224 B=18.
Step 32
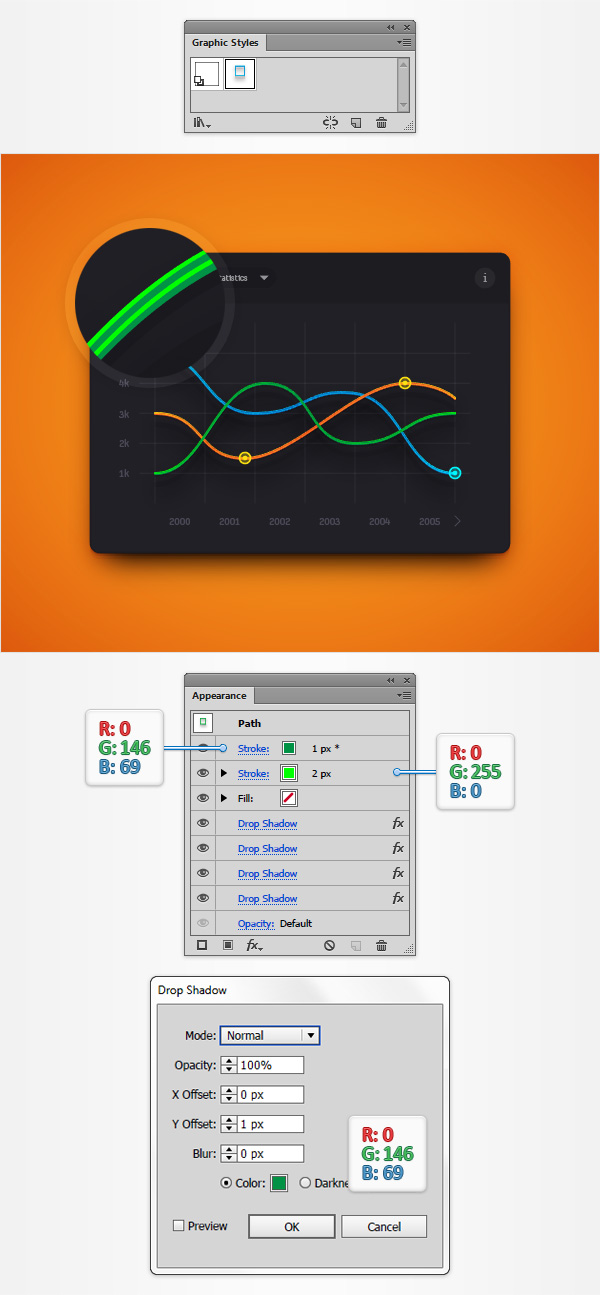
Using the Pen Tool (P), create a third wavy path roughly as shown in the following image.
Add your graphic style for this new path and then focus on the Appearance panel.
Replace the colors used for fill, stroke and top Drop Shadow effect with the ones indicated in the following image.
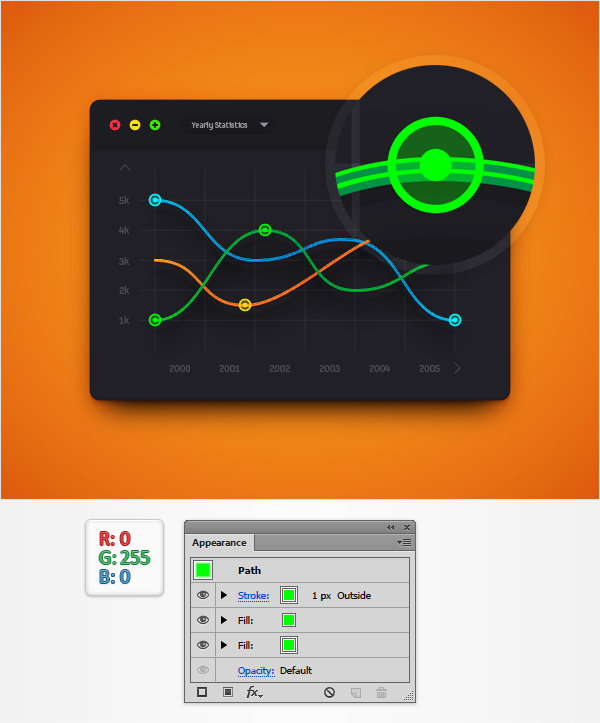
Step 33
Make another two copies of your 10 px circle (Control + C > Control + V). Place them roughly as shown in the following image and replace the color used for fills and stroke with R=0 G=255 B=0.
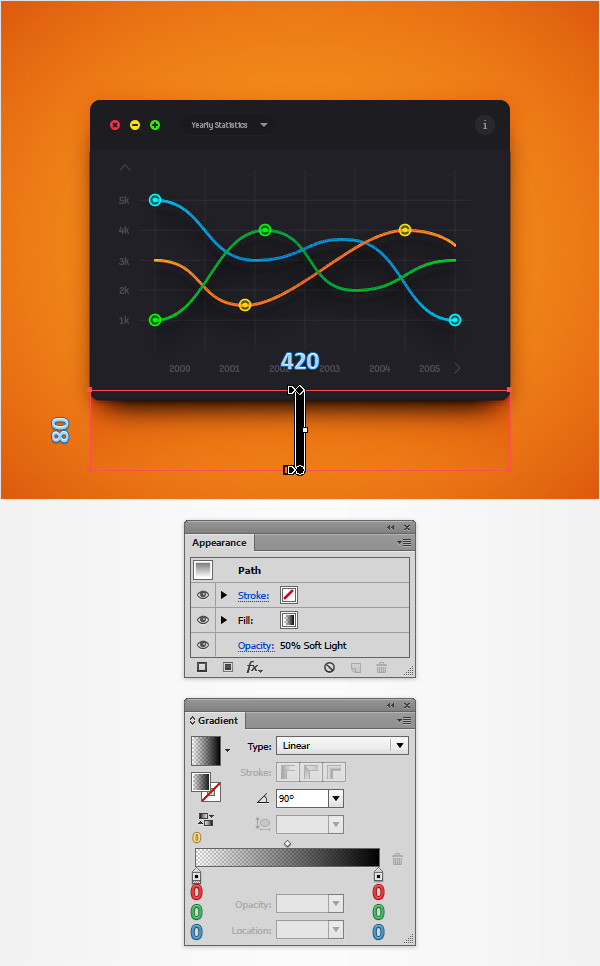
Step 34
Using the Rectangle Tool (M), create a 420 x 80 px shape and fill it with the linear gradient shown below.
Place this new rectangle as shown below and then lower its Opacity to 50% and change the Blending Mode to Soft Light.
Step 35
Finally, feel free to try a different background color.
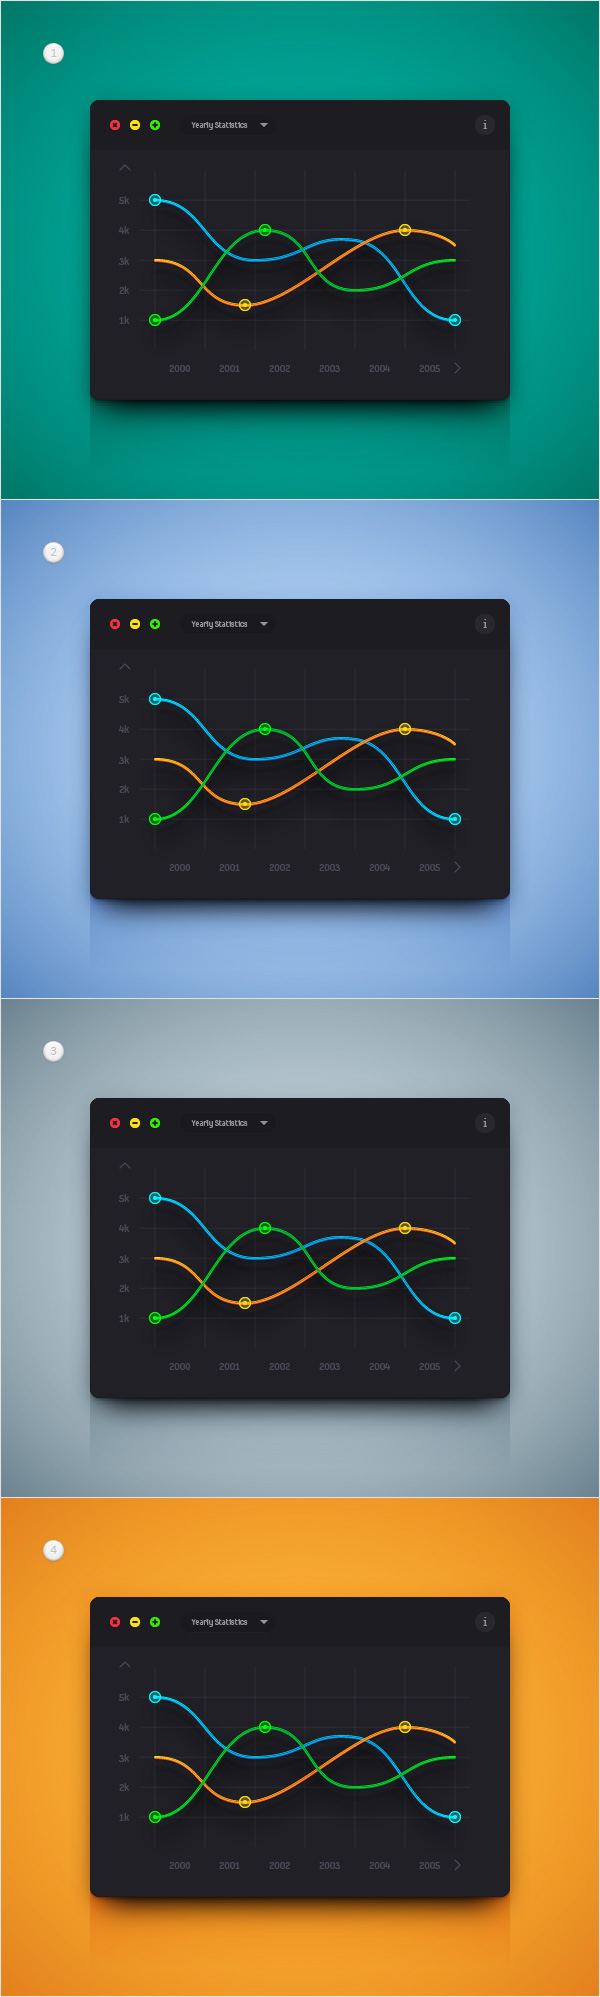
And We’re Done!
Here is how it should look. I hope you’ve enjoyed this tutorial and can apply these techniques in your future projects.
